
Construction intelligence

Clarity, from
the ground up.

Bring site photos, plans and progress into one clear view. See what has changed, understand what matters, and move your project forward.

From site evidence to confident decisions.

A connected perspective01 / FIELD VIEW
Every detail.
Part of the bigger picture.
Site imageryProject plansProgress
INFRARITY / A CLEARER VIEWBuilt around your project.
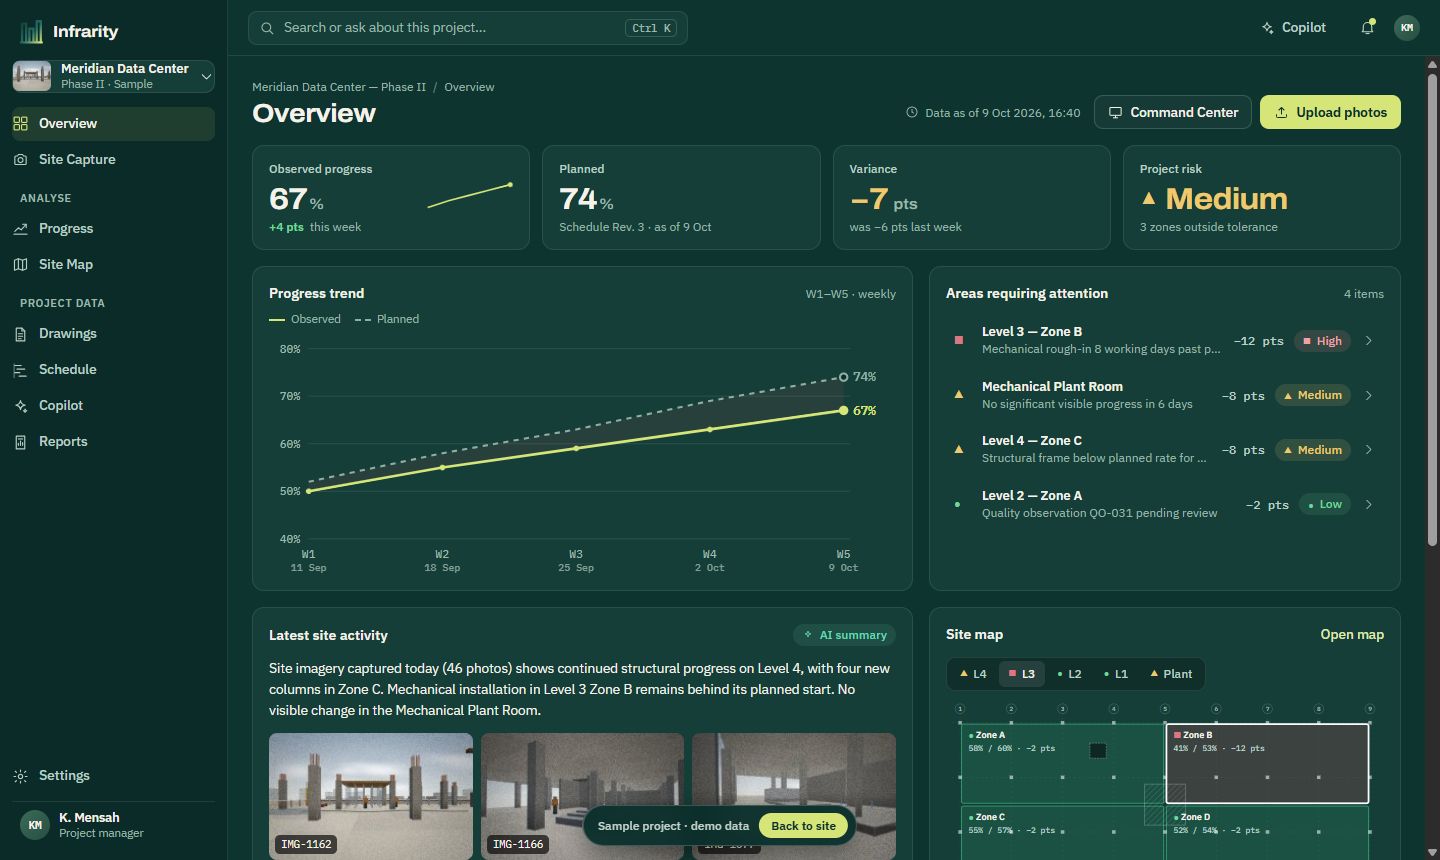
Infrarity · Meridian Data Center — Phase IILive demo · sample dataOpen full screen
Infrarity overview of the Meridian Data Center sample project: 67% observed against 74% planned, variance minus 7 points, medium risk, with areas requiring attention and a site map.

This is the working MVP on a sample project. Click around, or open it full screen.

What Infrarity does

Infrarity is a construction-intelligence concept. The sample project shows how site photos, drawings and a schedule could combine to reveal what has been built and where work is slipping.

In the sample workflow, observations of columns, formwork, blockwork and ductwork connect to a building, level, zone, drawing and schedule activity, with evidence alongside each finding.

Owners, contractors and engineers stop piecing status together from spreadsheets and photo folders. They open one view of the project's physical reality, and ask it questions.

Interactive product walkthrough

One site update.
A clearer picture.

Use the chapters to explore the Infrarity MVP on the Meridian sample project: capture, inspection comparison, progress, schedule risk, Copilot and the weekly report.

The problem

Construction projects generate data everywhere. Intelligence stays fragmented.

Every week a project produces thousands of photos, revised drawings, schedule updates, inspection records and daily reports. Teams still piece them together by hand to answer a simple question: where are we, really?

Infrarity connects those signals into one project-intelligence layer, so the answer comes with its evidence.

  • Site photos2,418
  • Drawings186
  • Schedule412 activities
  • InspectionsQA / QC
  • RFIsopen items
  • Daily reportssite diary
Infrarityproject graph
  • Progress
  • Risk
  • Quality
  • Answers

Sample week on Meridian Data Center — Phase II: 2,418 photos · 186 drawings · 412 schedule activities · 3 open quality observations

How it works

Capture. Understand. Act.

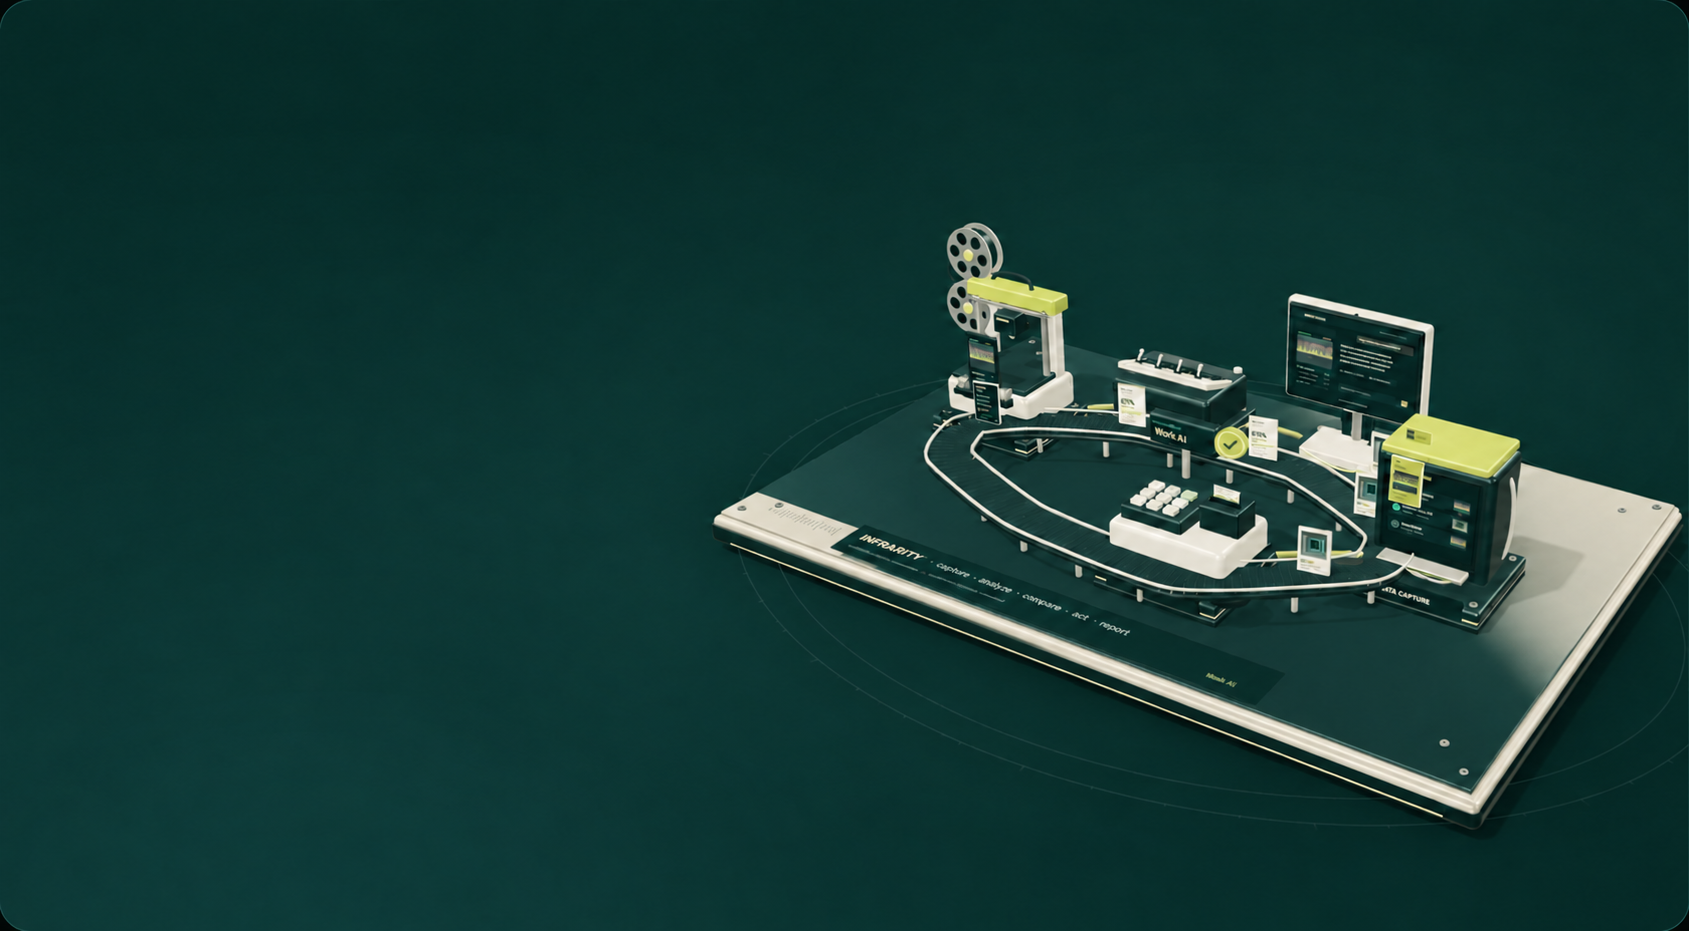
One pipeline turns site photos into confirmed progress and a weekly report. Turn the machine, open it up, or follow a single photo through it.

Drag to turn · click a stationTap a station for a closer look

  1. Teams photograph the site with any phone or upload a walkthrough video. Each batch is tagged to a building, level and zone.

  2. AI reads each image for columns, formwork, blockwork, ductwork, equipment and activity, with a confidence on every observation.

  3. Infrarity compares the photo with the previous inspection from the same viewpoint, the current drawings and the planned schedule.

  4. Progress gaps, stalled zones and potential quality issues are flagged, each with the photos that show it.

  5. Trends and the critical path show where delay is likely to spread next, using rules your team can read.

  6. Project managers confirm progress, ask Copilot follow-up questions and publish the weekly report in minutes.

Phone camera view of Level 4 Zone CLevel 4 — Zone C
12 photosUpload
9 Oct · 10:42Viewpoint L4-C NE corner · tagged on upload
  • Concrete columns × 17 96%
  • Slab formwork and props 91%
  • Blockwork wall 88%
Level 4 Zone C on 5 October
Mon 5 Oct51%
Level 4 Zone C on 9 October
Fri 9 Oct63%
Observed63%
Planned71%

Areas requiring attention

  • ■Level 3 — Zone BRough-in 8 days late−12
  • ▲Mechanical Plant RoomNo change in 6 days−8
  • ▲Level 4 — Zone CBelow planned rate−8
Why is Zone B behind schedule?

MEC-112 (mechanical rough-in, Level 3 Zone B) has not started, 8 working days after its planned start on 29 September. None of the 23 photos of that zone since then show ductwork or supports.12

✓Weekly report drafted · 5–9 Oct 2026

Core capabilities

One upload. Every answer about the site.

Every demo below runs on the same sample project. Try them.

Visual intelligence

Your site photos become measurable progress.

Drag across Monday's and Friday's inspection of Level 4 Zone C. Infrarity found four new columns, more blockwork and finished formwork, and noticed that mechanical work has not started.

  1. 14 new structural columns C14–C17
  2. 2Blockwork along grid 6 ≈18 m
  3. 3Formwork completed bay 4C-2
  4. 4Mechanical work not started
Observed63%
Planned71%
Variance−8 pts

Drag the handle, or use the arrow keys. Overlays show what changed.
Progress intelligence

Know whether reported progress matches physical progress.

ObservedPlanned

Drawing intelligence

Connect what's being built with what was designed.

  1. PhotoIMG-1162
  2. LocationBuilding A · Level 4 · Zone C
  3. ElementColumn C17
  4. DrawingS-204 Rev.5
  5. Specification03 30 00
  6. ScheduleSTR-043

Infrarity Copilot

Ask your project.

Copilot answers from this project's photos, drawings, schedule and observations, and attaches the evidence. When the data cannot answer a question, it says so.

  • Numbers come from the project record, never from the model
  • Every ID it mentions is checked before it is shown
  • Answers stay inside the data your role can see
Ask your own questions in a live demoRequest a demo

Quality intelligence

Surface potential issues earlier.

Concrete soffit on Level 2 Zone A with the potential defect boxed
Observation
QO-031 · Pending review
Location
Building A — Level 2, Zone A
AI observation
Potential surface defect identified in recently completed concrete area.
Evidence
IMG-1147 · 8 Oct
Confidence
82%
Action
Engineering review recommended.

Infrarity flags potential issues for professional review. It does not certify structural condition.

Project map

See risk where it is, not in a spreadsheet.

Technology

Five AI passes behind every upload.

Infrarity is more than a chatbot over PDFs. It sees the site, places what it sees in the project, and measures it against the plan, with rules a project manager can read.

  1. 01

    Reads the photo

    A vision pass records what is visible: elements, activity and condition, each with a confidence. Only what it can see.

  2. 02

    Places it in the project

    Each observation is linked to a building, level, zone, element, drawing and schedule activity in the project graph.

  3. 03

    Compares over time

    Captures from the same viewpoint are compared, so change between inspections becomes a measured difference.

  4. 04

    Scores progress and risk

    Weighted activity checklists turn changes into progress, and variance plus the critical path turns progress into risk.

  5. 05

    Explains with evidence

    Copilot answers and weekly reports cite the photos, drawings and activities behind every statement.

Sample data only. This public MVP illustrates the workflow; a connected customer workspace and its security controls remain to be built.

See the technology

Who it's for

Built for everyone who needs the truth about progress.

  • Project owners

    Is the progress I'm paying for actually built?

    Verify progress independently, with photo evidence behind every number.

  • General contractors

    Where are we losing time across trades?

    See variance by zone, package and subcontractor, and the areas with no visible progress.

  • Project managers

    What needs my attention this week?

    A ranked list of problem areas and a weekly report drafted from confirmed data.

  • Engineers

    Which drawing applies to what I'm looking at?

    The current revision for any photographed element, and quality observations to review.

  • Construction executives

    Which projects need intervention?

    The same measures across every project, from portfolio down to a single photo.

Built for complex physical projects

  • Data centersMission-critical construction monitoring
  • Commercial constructionBuilding and development projects
  • Industrial projectsFactories, warehouses and production facilities
  • InfrastructureTransportation and civil projects
  • EnergyPower and energy infrastructure
  • Large residentialMulti-building development monitoring

The shift

Move from reporting progress to understanding it.

TodayWith Infrarity
Manual photo reviewAutomated comparison between inspections
Spreadsheet progress trackingProgress measured from site evidence
Drawings in separate foldersPhotos linked to the current drawing revision
Status scattered across reportsOne project-intelligence layer
Risks found at the monthly meetingEarly warnings from trends and the critical path
Weekly report written by handWeekly report drafted from confirmed data

Security

Security for real project data.

The public MVP uses fictional records. A connected workspace for real projects will require verified access controls, isolation, audit logs and retention settings.

Security details
  • EncryptionRequired for customer data
  • Secure sign-inPlanned for connected workspaces
  • Role-based accessPlanned for each project
  • Organisation isolationPlanned at the data layer
  • Audit trailPlanned for key actions
  • Retention controlsPlanned for administrators
  • Production hostingTo be reviewed before a pilot

Early access

Start with one project.

Explore the sample project and see how a pilot could track progress, risks and evidence in one place.

  1. 1Talk

    A 30-minute call about your projects and how you report progress today.

  2. 2See it on your site

    Walk through the sample project from site capture to weekly report.

  3. 3Pilot

    One project, agreed success measures and a weekly check-in.

FAQ

Questions teams ask first.

Can't find yours? Talk to us.

How does Infrarity measure progress from photos?

Each zone has a checklist built from its schedule activities, weighted by planned duration. Infrarity reads each photo, compares it with the previous capture from the same viewpoint, and suggests a percentage for each item. A project manager confirms the suggestion before it changes any reported figure.

Do we need drones, fixed cameras or special hardware?

No special hardware is needed to explore the sample. The intended workflow uses ordinary site photos; video and automated ingestion are future integrations.

Does it replace our scheduling or project-management software?

No. The concept links site evidence to a schedule and drawing register. The public MVP uses sample records and is not connected to your planning tools.

How accurate is it, and who has the final say?

Every AI observation carries a confidence and its evidence. Low-confidence results go to a person, progress suggestions need confirmation, and quality findings are potential observations for professional review, never certifications.

What happens to our project data?

This public preview uses fictional data and does not provide a customer workspace. Do not upload sensitive project records here. Security and retention controls must be implemented and verified before a real-data pilot.

Which files can we bring?

The public preview uses prepared sample files. Customer file ingestion is not available here.

Where does Infrarity run?

The public sample runs as a hosted static website. Production infrastructure for customer data has not been connected to this preview.

Know what's built, not just what's reported.

See Infrarity on the sample project, then on your own site photos.